Another tech tutorial!
I’ve been on a productivity kick for forever! I’ve also been looking for an excuse to post things on Twitter. With that simple premise, I thought it’d be cool if I could use some cloud tools to collect my tweets and create dashboards telling me if I’m spending my time well or just spending my time.
From a high level: I’m going to use Azure Logic Apps to pull the content of my tweets and store them into a SQL database. From there, I will use Power BI to connect to the SQL database and transform the data into pretty visuals. Nothing screams productivity like a good-looking dashboard, am I right?
To keep a simple and cost-effective task, I wanted to make sure that I was only grabbing the information I needed. So I decided on this structure for my tweets:
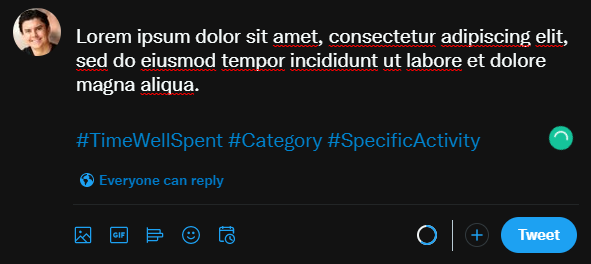
The Key:
- Hashtag 1: TimeSpent OR TimeWellSpent
- Hashtag 2: The main category on what I was spending my time on (Learning, Exercise, etc.)
- Hashtag 3: The specific Activity (Azure, Peloton, etc.)
This way, I was doing all of the heavy liftings.
The Order of Deployment
From a high level perspecting we’ll need to create the storage for the information to be stored, connect Twitter to Azure Logic Apps, and then connect Power BI to the SQL storage.
The order that you’ll need to deploy:
- Create the SQL Database
- Create the table and columns for the data
- Create the Logic App
- Connect to Twitter
- Create a Trigger based off of a new tweet from my account
- Create an Action to insert a new row into the SQL database
- Connect Power BI to the SQL database
- Transform the data
- Create Visualizations
- Set a schedule for the data to refresh
Step 1: Create the Azure SQL Database
Azure SQL Database is a relational database-as-a-service (DBaaS) hosted in Azure that falls into the industry category of Platform-as-a-Service (PaaS). I chose Azure SQL simply because it would allow me to use JSON down the road, and it gave me total control with Columnstore and Rowstore.
While creating the SQL Database, the first thing you need to do is search for SQL Databases.
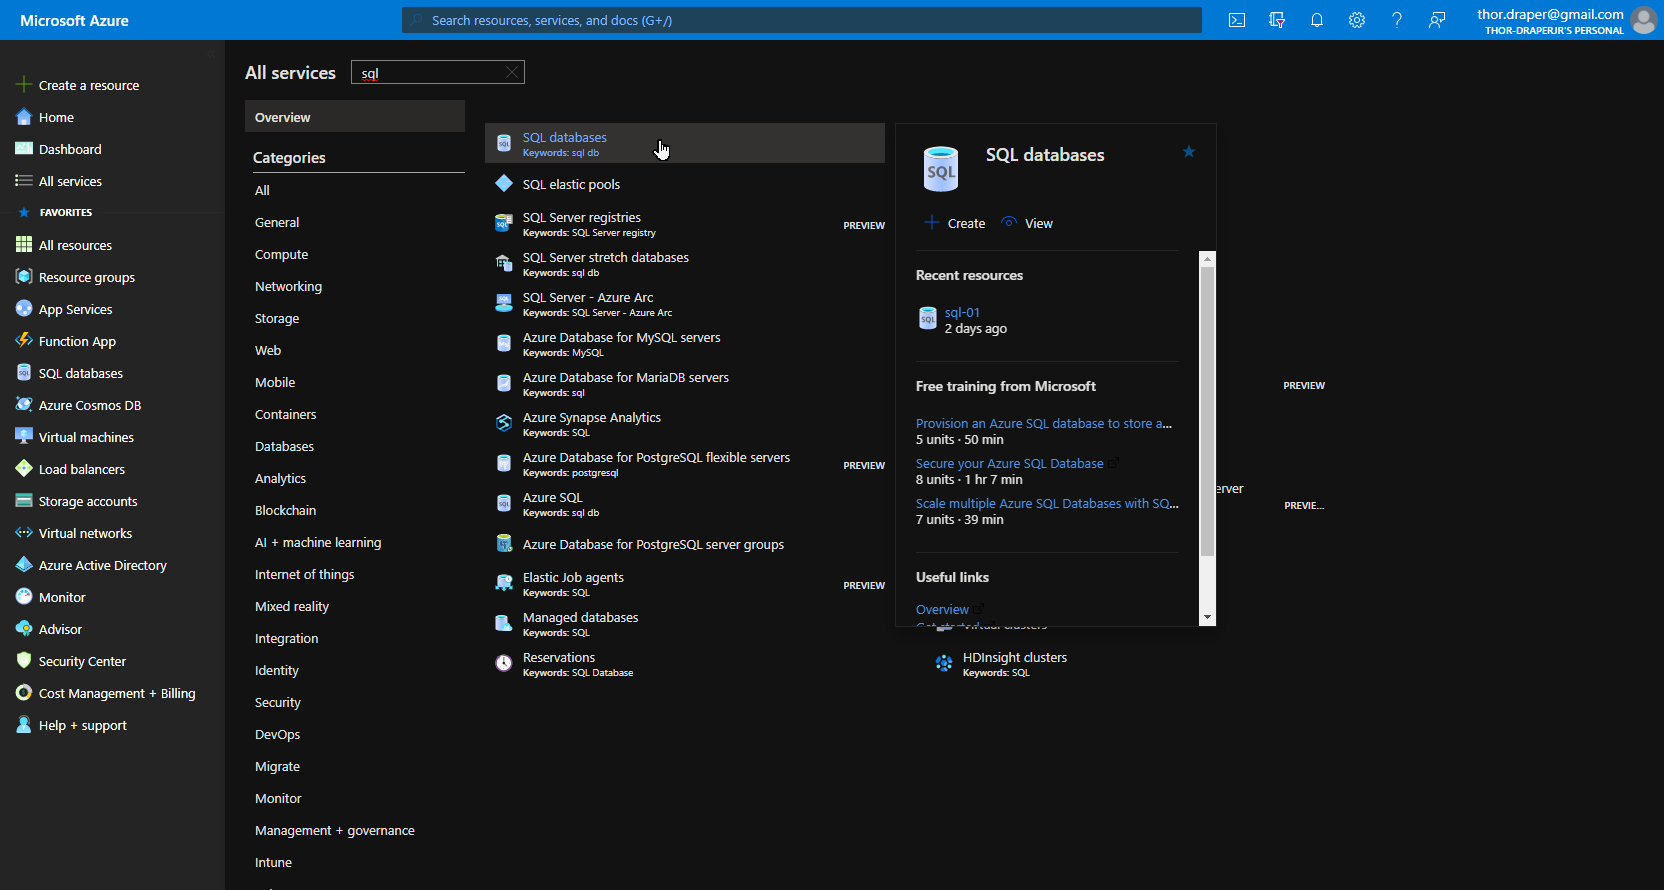
On the next prompt, you’ll be taken to the screen to Create SQL Database. This has six pages in the tab: Basics, Networking, Security, Additional settings, Tags, and Review + create.
```azure cli
Basics
Project details
Subscription: Azure subscription 1
Resource Group: rg-01
Database details
Database name: sql-01
Server: thordraperjr-sql-server-01
+Username:
+Password:
Want to use SQL elastic pool? No
Compute + storage: Basic
Backup storage redundancy
Backup storage redundancy: Locally-redundant backup storage - Preview
Networking
Network connectivity
Connectivity method: No access
Connection Policy
Connection policy: Default
Encrypted connections
Minimum TLS version: TLS 1.2
Security
Azure Defender for SQL
Enable Azure Defender for SQL: []Start free trial(30 Days)[x]Not now
Additional settings
Datasource
Use existing data: None
Database collation
Collation: SQL_Latin_General_CP1_CI_AS
Maintenance window
Maintenance window: System default (5pm to 8am)
Tags
Development:Twitter-to-PowerBi-App
I choose Basic computing and storage because it was relatively inexpensive, and I wouldn't have a very high workload.
Once the database was provisioned, I used the Query editor (preview) to create my table and columns for the server.
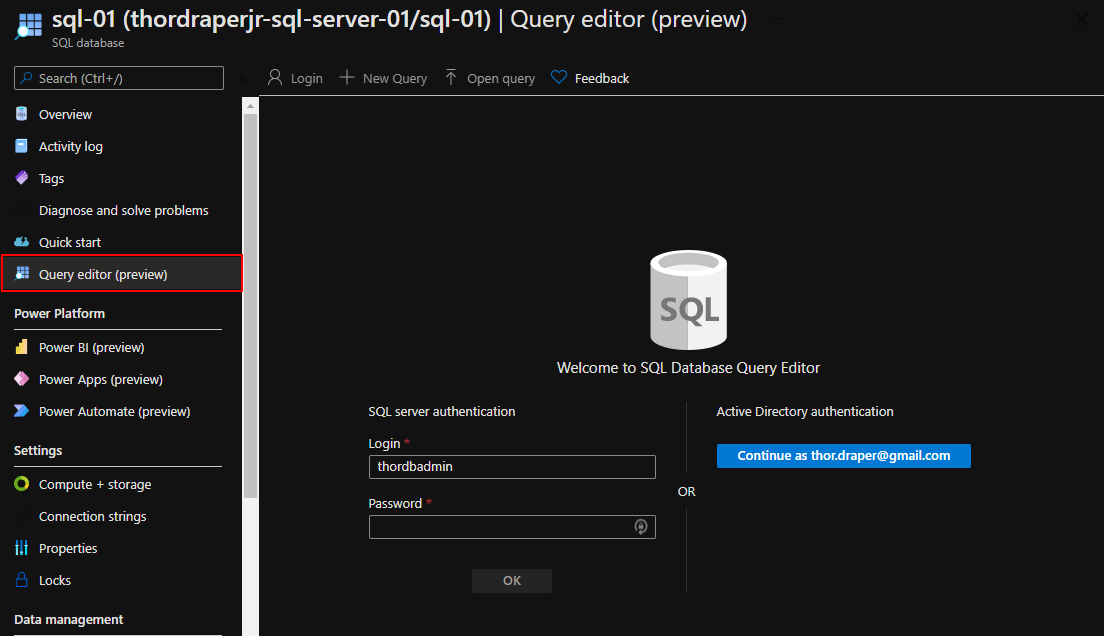
The next step was to enter the following query:
```sql
CREATE TABLE TweetData (
CreatedAt datetime,
TweetText varchar(512),
);
Once this is done, we can move onto creating the Logic App
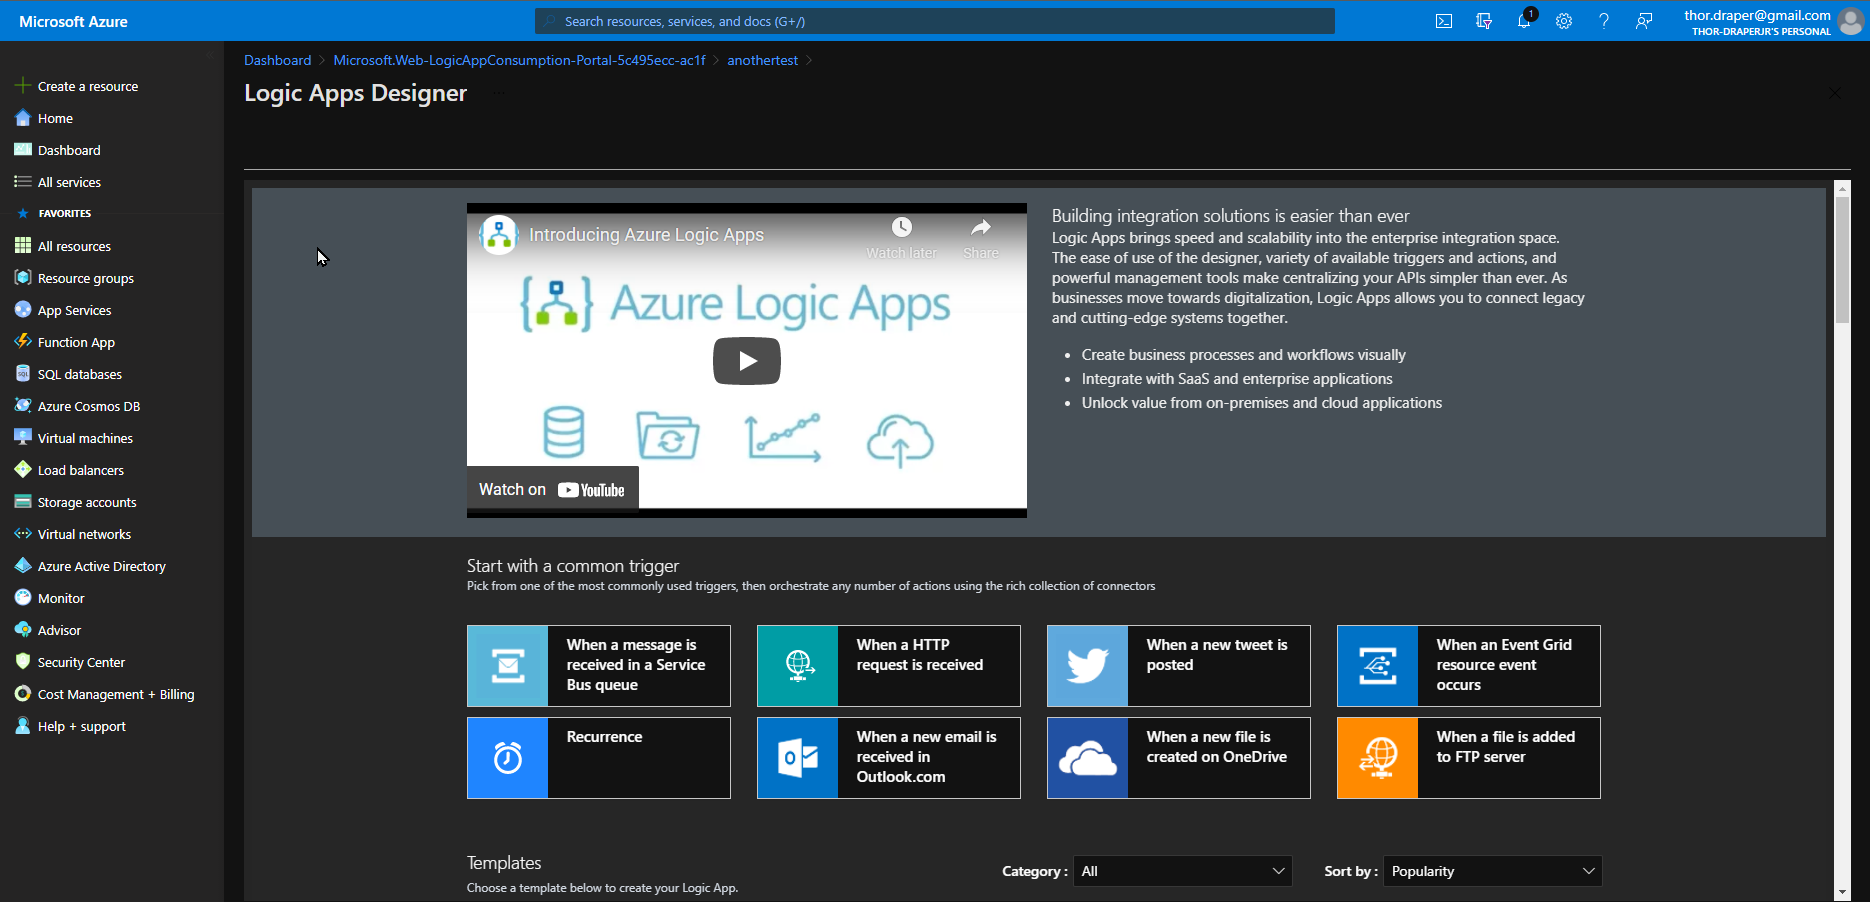
Step 2: Create the Azure Logic App
Azure Logic Apps is a cloud-based platform for creating and running automated workflows that integrate your apps, data, services, and systems. For us, this will be the brains of grabbing connect from tweets and putting it into the SQL database.
The next step is to navigate to the portal and search for Logic Apps.
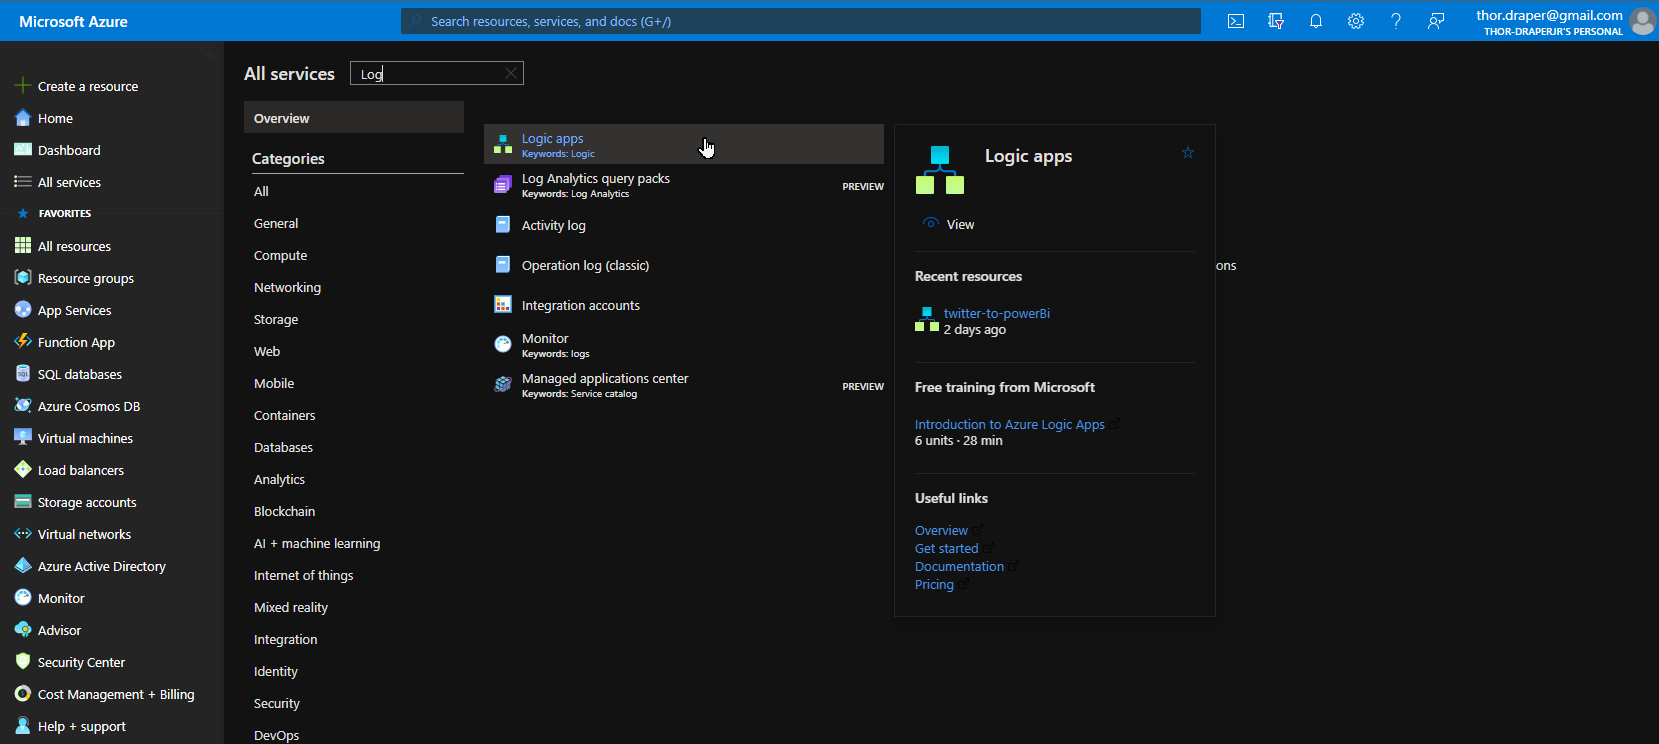
On the next prompt, you’ll be taken to the screen to Create SQL Database. When you open the create option, you’ll see a page with five tabs. You don’t need to pay attention to them for now because we will choose a consumption plan. Once you select that option, the tabs will simplify to three: Basics, Tabs, and Review + create.
```azure cli
Basics
Project details
Subscription: Azure subscription 1
Resource Group: rg-01
Instance details
Type: [x] Consumption [] Standard
Logic App name: twitter-to-powerBi
Region: East US
Enable log analytics: [] Yes [x] No
Tags
Development:Twitter-to-PowerBi-App
The first 4000 actions are free. So unless you start tweeting a whole bunch, you probably won't need anything more than that.
### Set up your connector, trigger, and action
A connector is a proxy or a wrapper around an API that the underlying service uses to communicate with Azure Logic Apps. When you build workflows using Azure Logic Apps, you can use connectors to help you quickly and easily access data, events, and resources in other apps, services, systems, protocols, and platforms - often without writing any code.
We are going to select "[When a new tweet is posted](https://docs.microsoft.com/en-us/connectors/twitter/#when-a-new-tweet-is-posted)". This will take you to the Logic App Designer, where you can connect to Twitter by signing in.
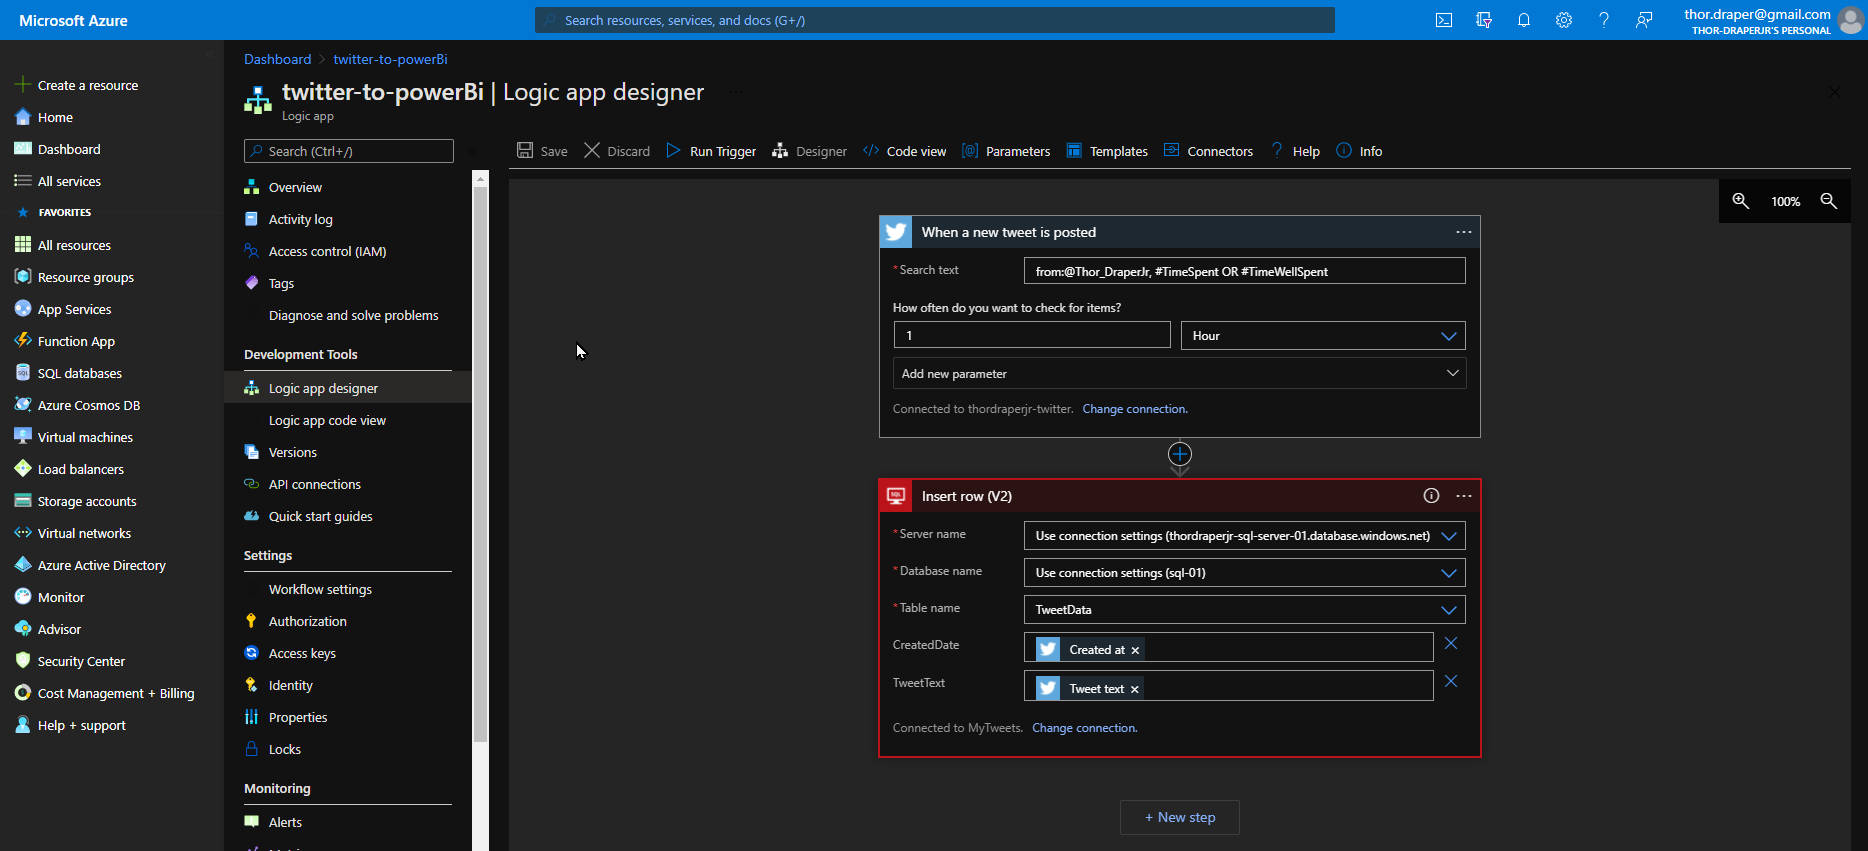
The trigger is:
```azure
Search text: from:@Thor_DraperJr, #TimeSpent OR #TimeWellSpent
How often do you want to check for items? 1 | Hour
This trigger will check anything posted from my Twitter handle containing the hashtag #TimeSpent or #TimeWellSpent once an hour.
The action is insert row:
Insert row (V2)
Server name: Use connection settings (thordraperjr-sql-server-01.database.windows.net)
Database name: Use connection settings (sql-01)
Table name: TweetData
Parmeter 1: `CreatedAt` `Created at`<--Dynamic content
Parmeter 2: `TweetText` `Tweet text`<--Dynamic content
This is going to add the content to a new row in our SQL table.
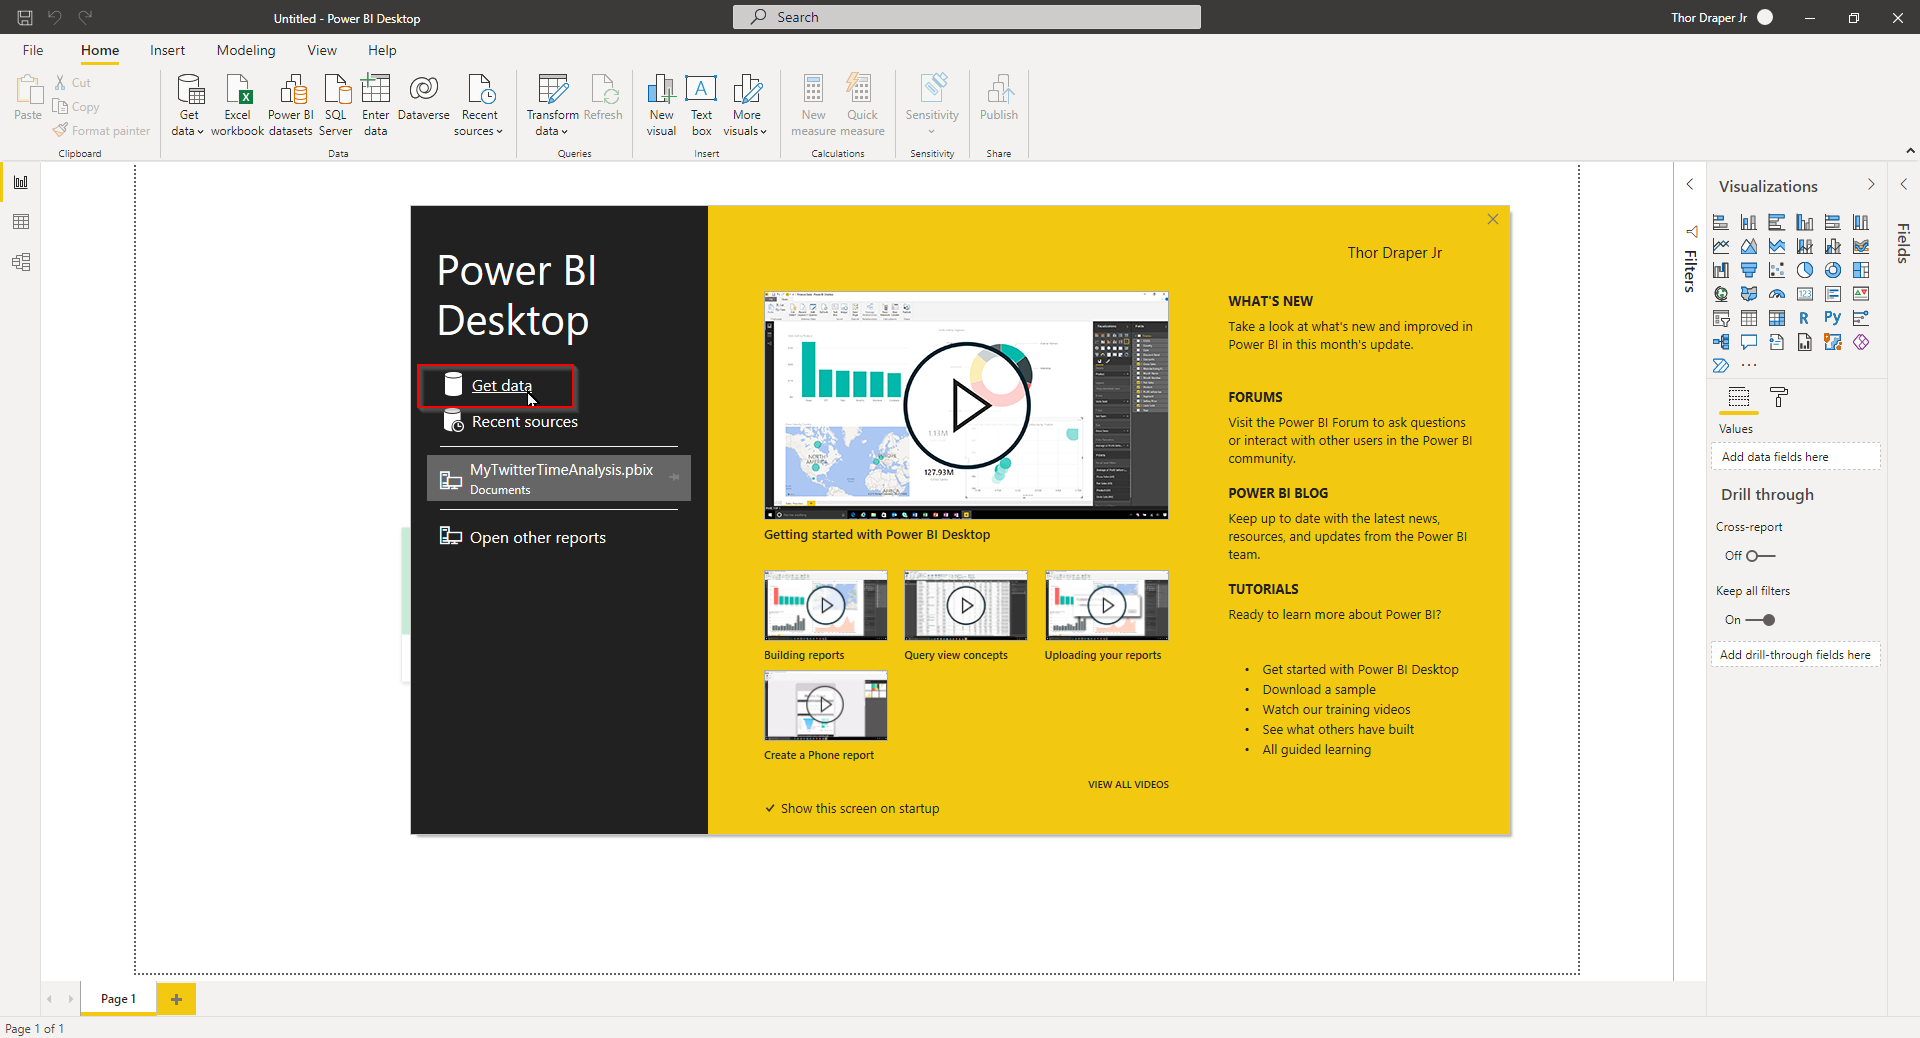
Step 3: Setting up Power BI
You can sign up for Power BI here. Keep in mind that you’ll need a work or school email address to access the free trial. Once your account is set up, you’ll also need to download the desktop app. We are going to be transforming the data.
First, you need to add your data source to your desktop app.
Next, you’ll need to search for the Azure SQL database.
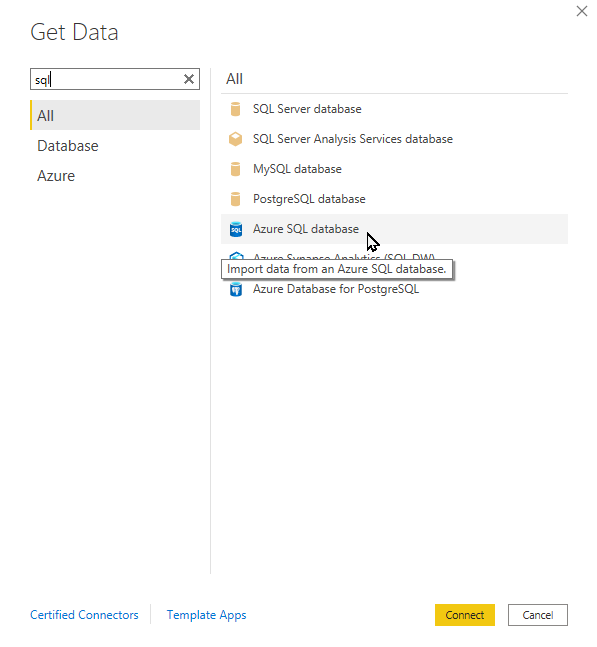
A pop-up will ask for your SQL server name, and for Database Connectivity, you’ll need to choose “Import” as DirectQuery will not allow us to transform the data.
Once you pull your data down, you’ll see some information in the fields tab on the far right. Next, open up the Transform data tab to add some delimiters where we can separate the data fields to match: Tweet, Hashtag 1, Hashtag 2, Hashtag 3. The two delimiters you’ll need to add are a custom delimiter as a # and the second being a Space.
Now that the data is ready, it’s time to move onto the dashboards.
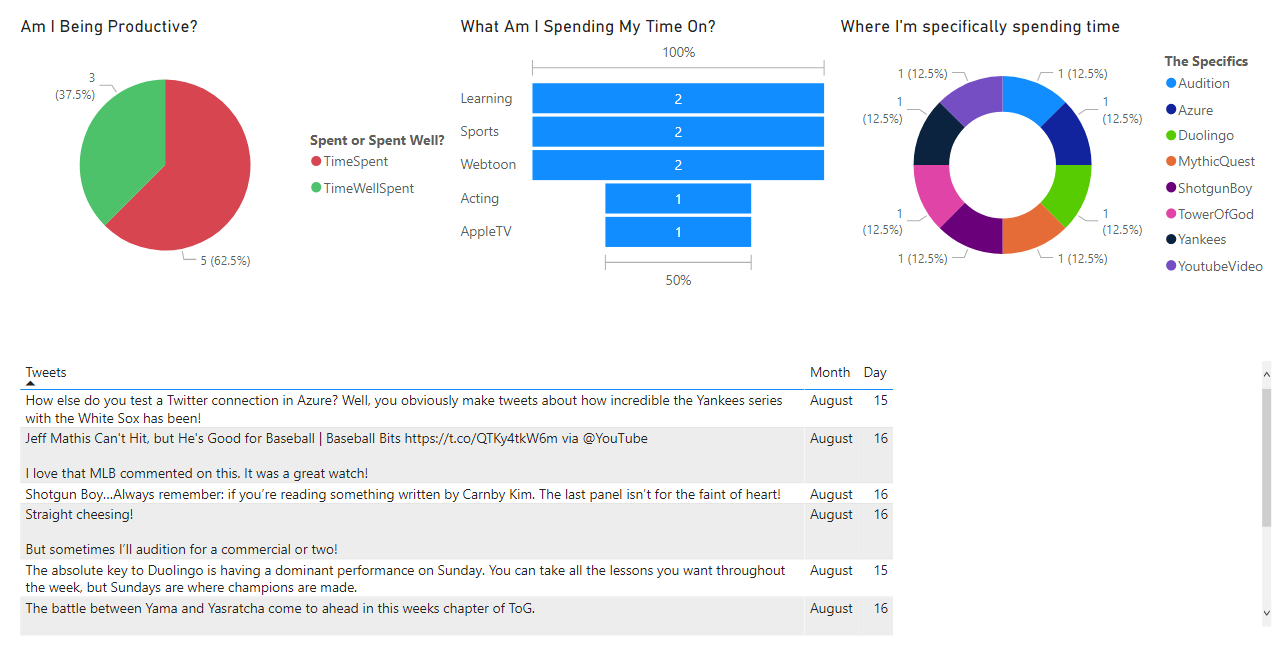
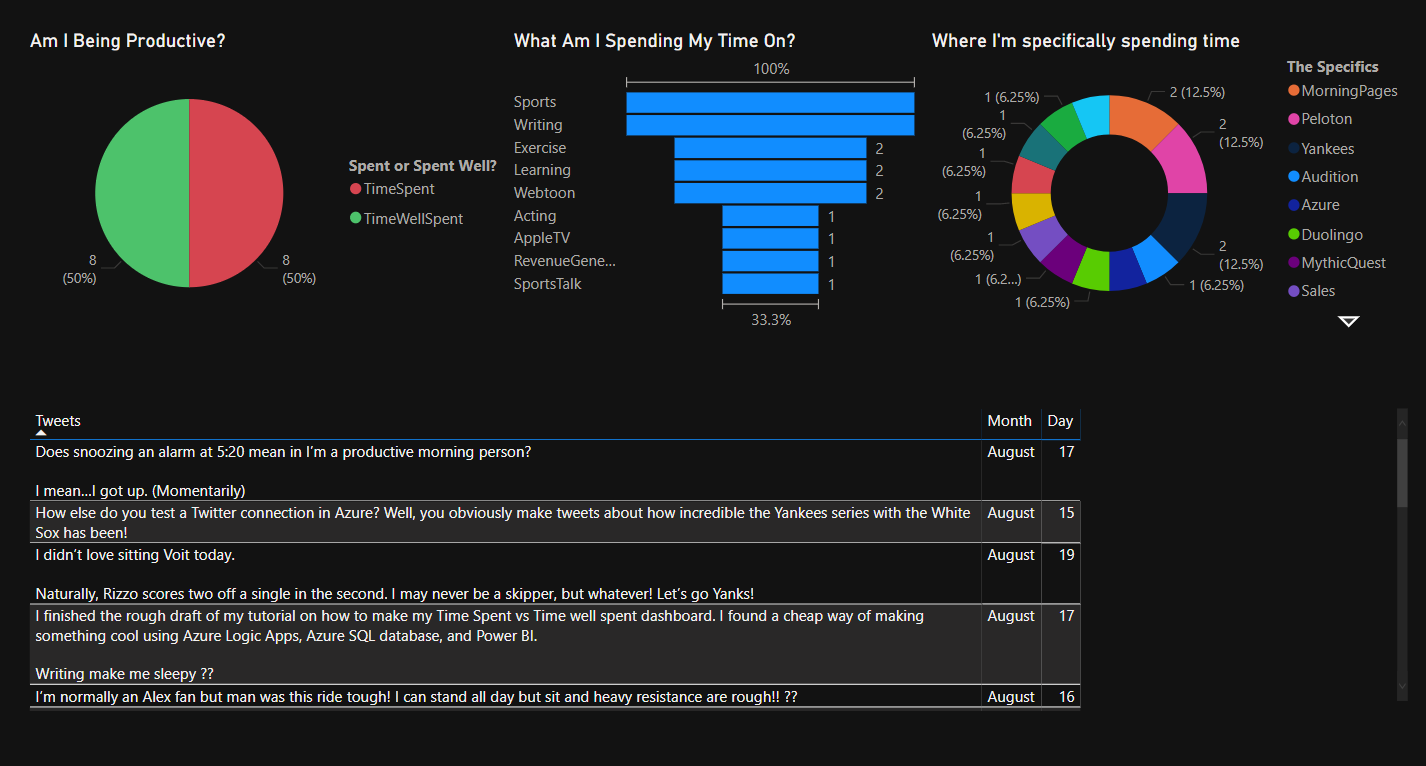
In the visualization tab, you’ll see images where you can choose a type of graph. Directly underneath that, you have three icons: Field, Format, Analytics. Underneath that, you have the option to put in the information for the graph. I made the Legend and the Values match data.
I used a Pie chart(Legend/Values = TweetText.2/Count of TweetText.2), a Funnel chart (Group/Values = TweetText.3/Count of TweetText.3), and a Donut chart (Legend/Values = TweetText.4/Count of TweetText4). Although, I’m probably changing that as more data is in the table)
Next, clicking the Analytics button will let you customize the Legend, Data colors, and Title.
Step 4: Setting Up Auto Refresh
From the Power BI web portal navigate to your newly created workspace and update the settings.
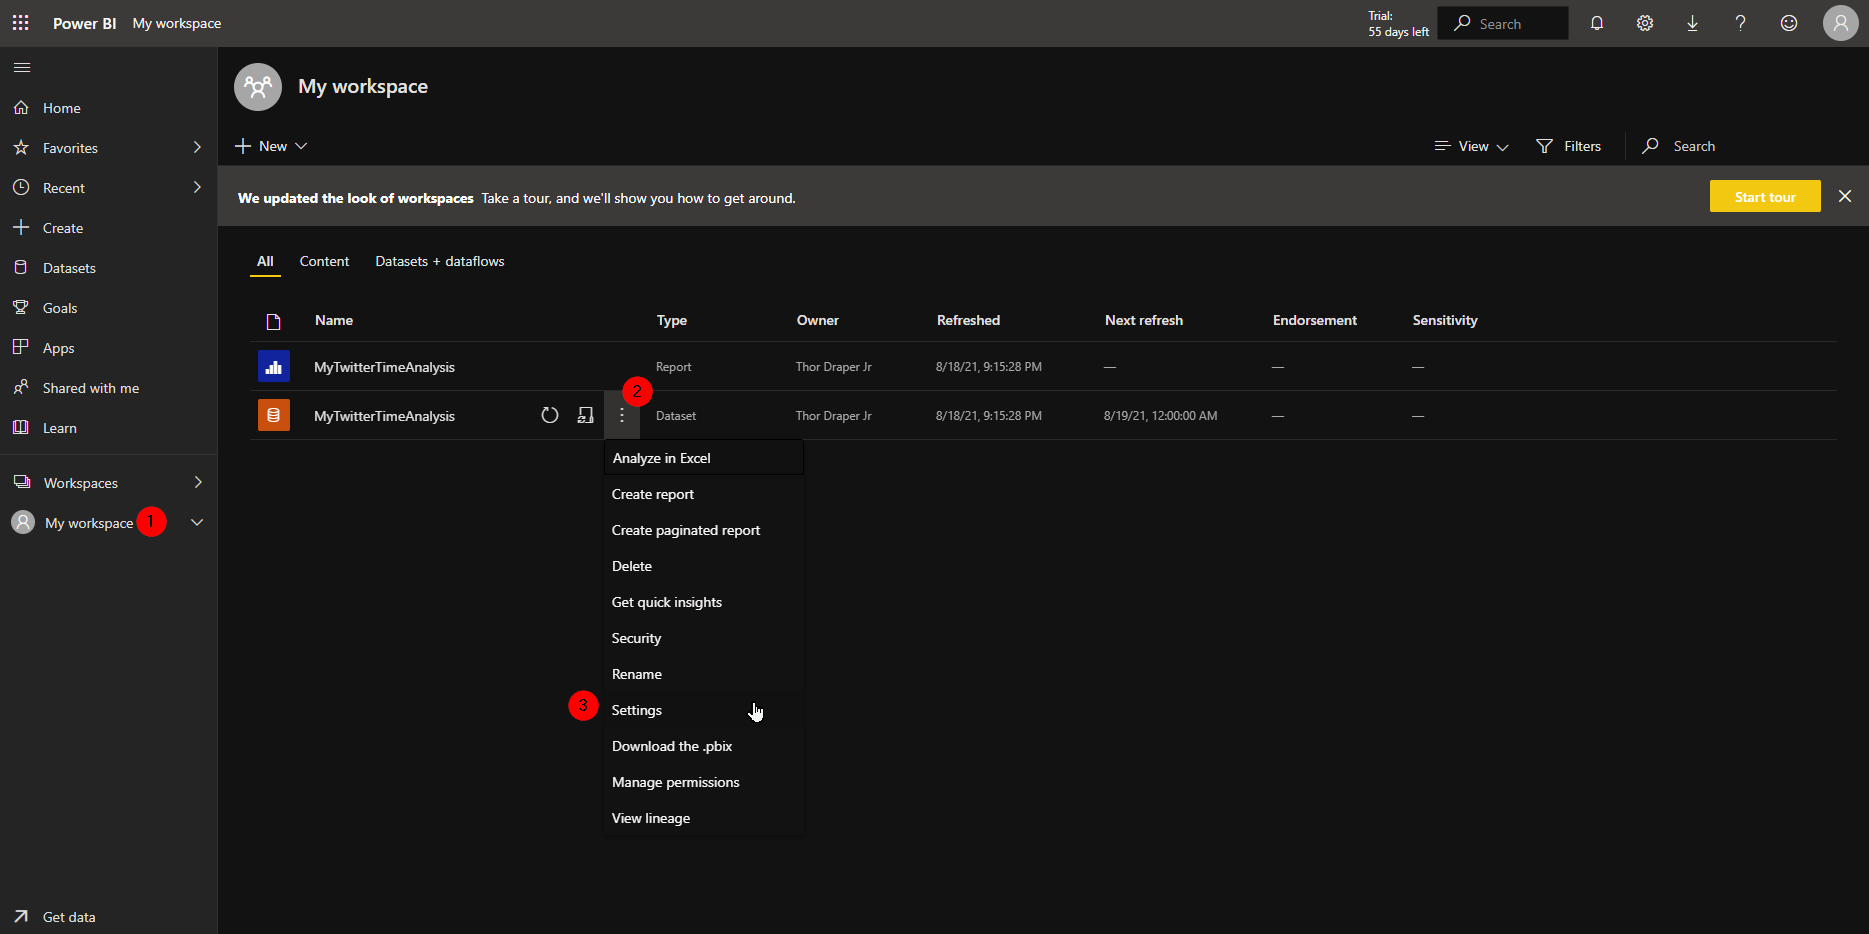
Scheduled refresh is one of the options to choose in the drop-down. You can set the frequency so the dashboard updates and pulls the latest data from your Azure SQL database.
Tips
SQL
Drop TABLE TweetData; <—Delete the entire tableALTER TABLE dbo.TweetData ADD CreatedAt datetime; <–Add a columnSELECT CreatedDate, TweetText FROM TweetData; <— Select all info in columnsDELETE FROM TweetData; <— deleting all data in the SQL database
Troubleshooting
Keep in mind if you locked down your SQL server you’ll need to find the range of IP address that are trying to do refreshes.